
Inference Endpoints (dedicated) documentation
Foundations
Foundations
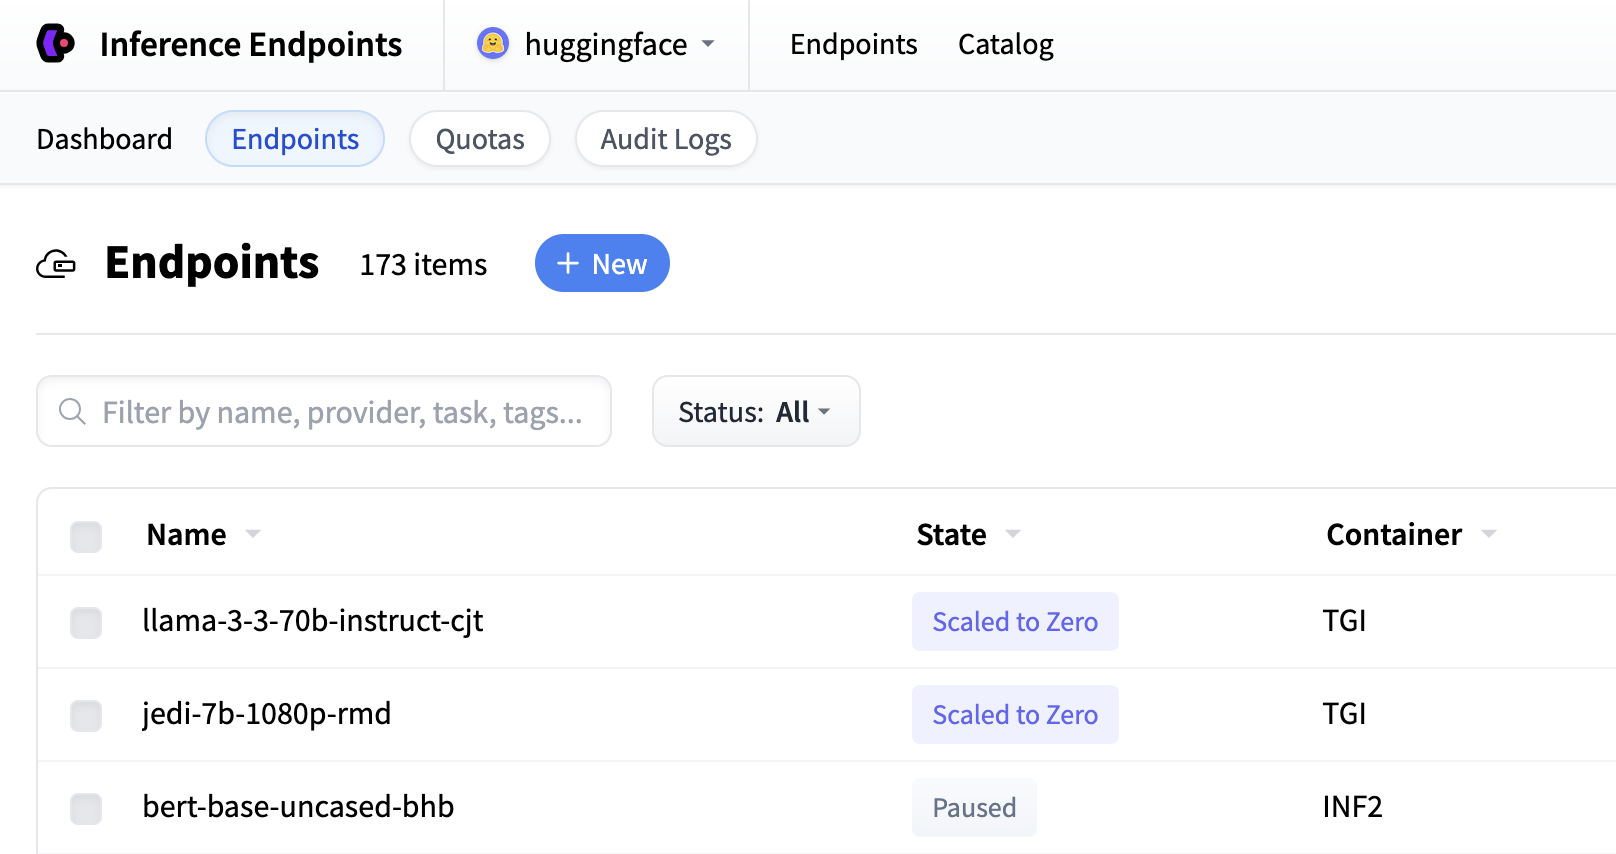
The Inference Endpoints dashboard is the central interface to manage, monitor, and deploy inference endpoints across multiple organizations and accounts. Users can switch between organizations, view endpoint statuses, manage quotas, and access deployment configurations. You can access the dashboard by logging in on endpoints.huggingface.co
Managing Endpoints
Creating New Endpoints
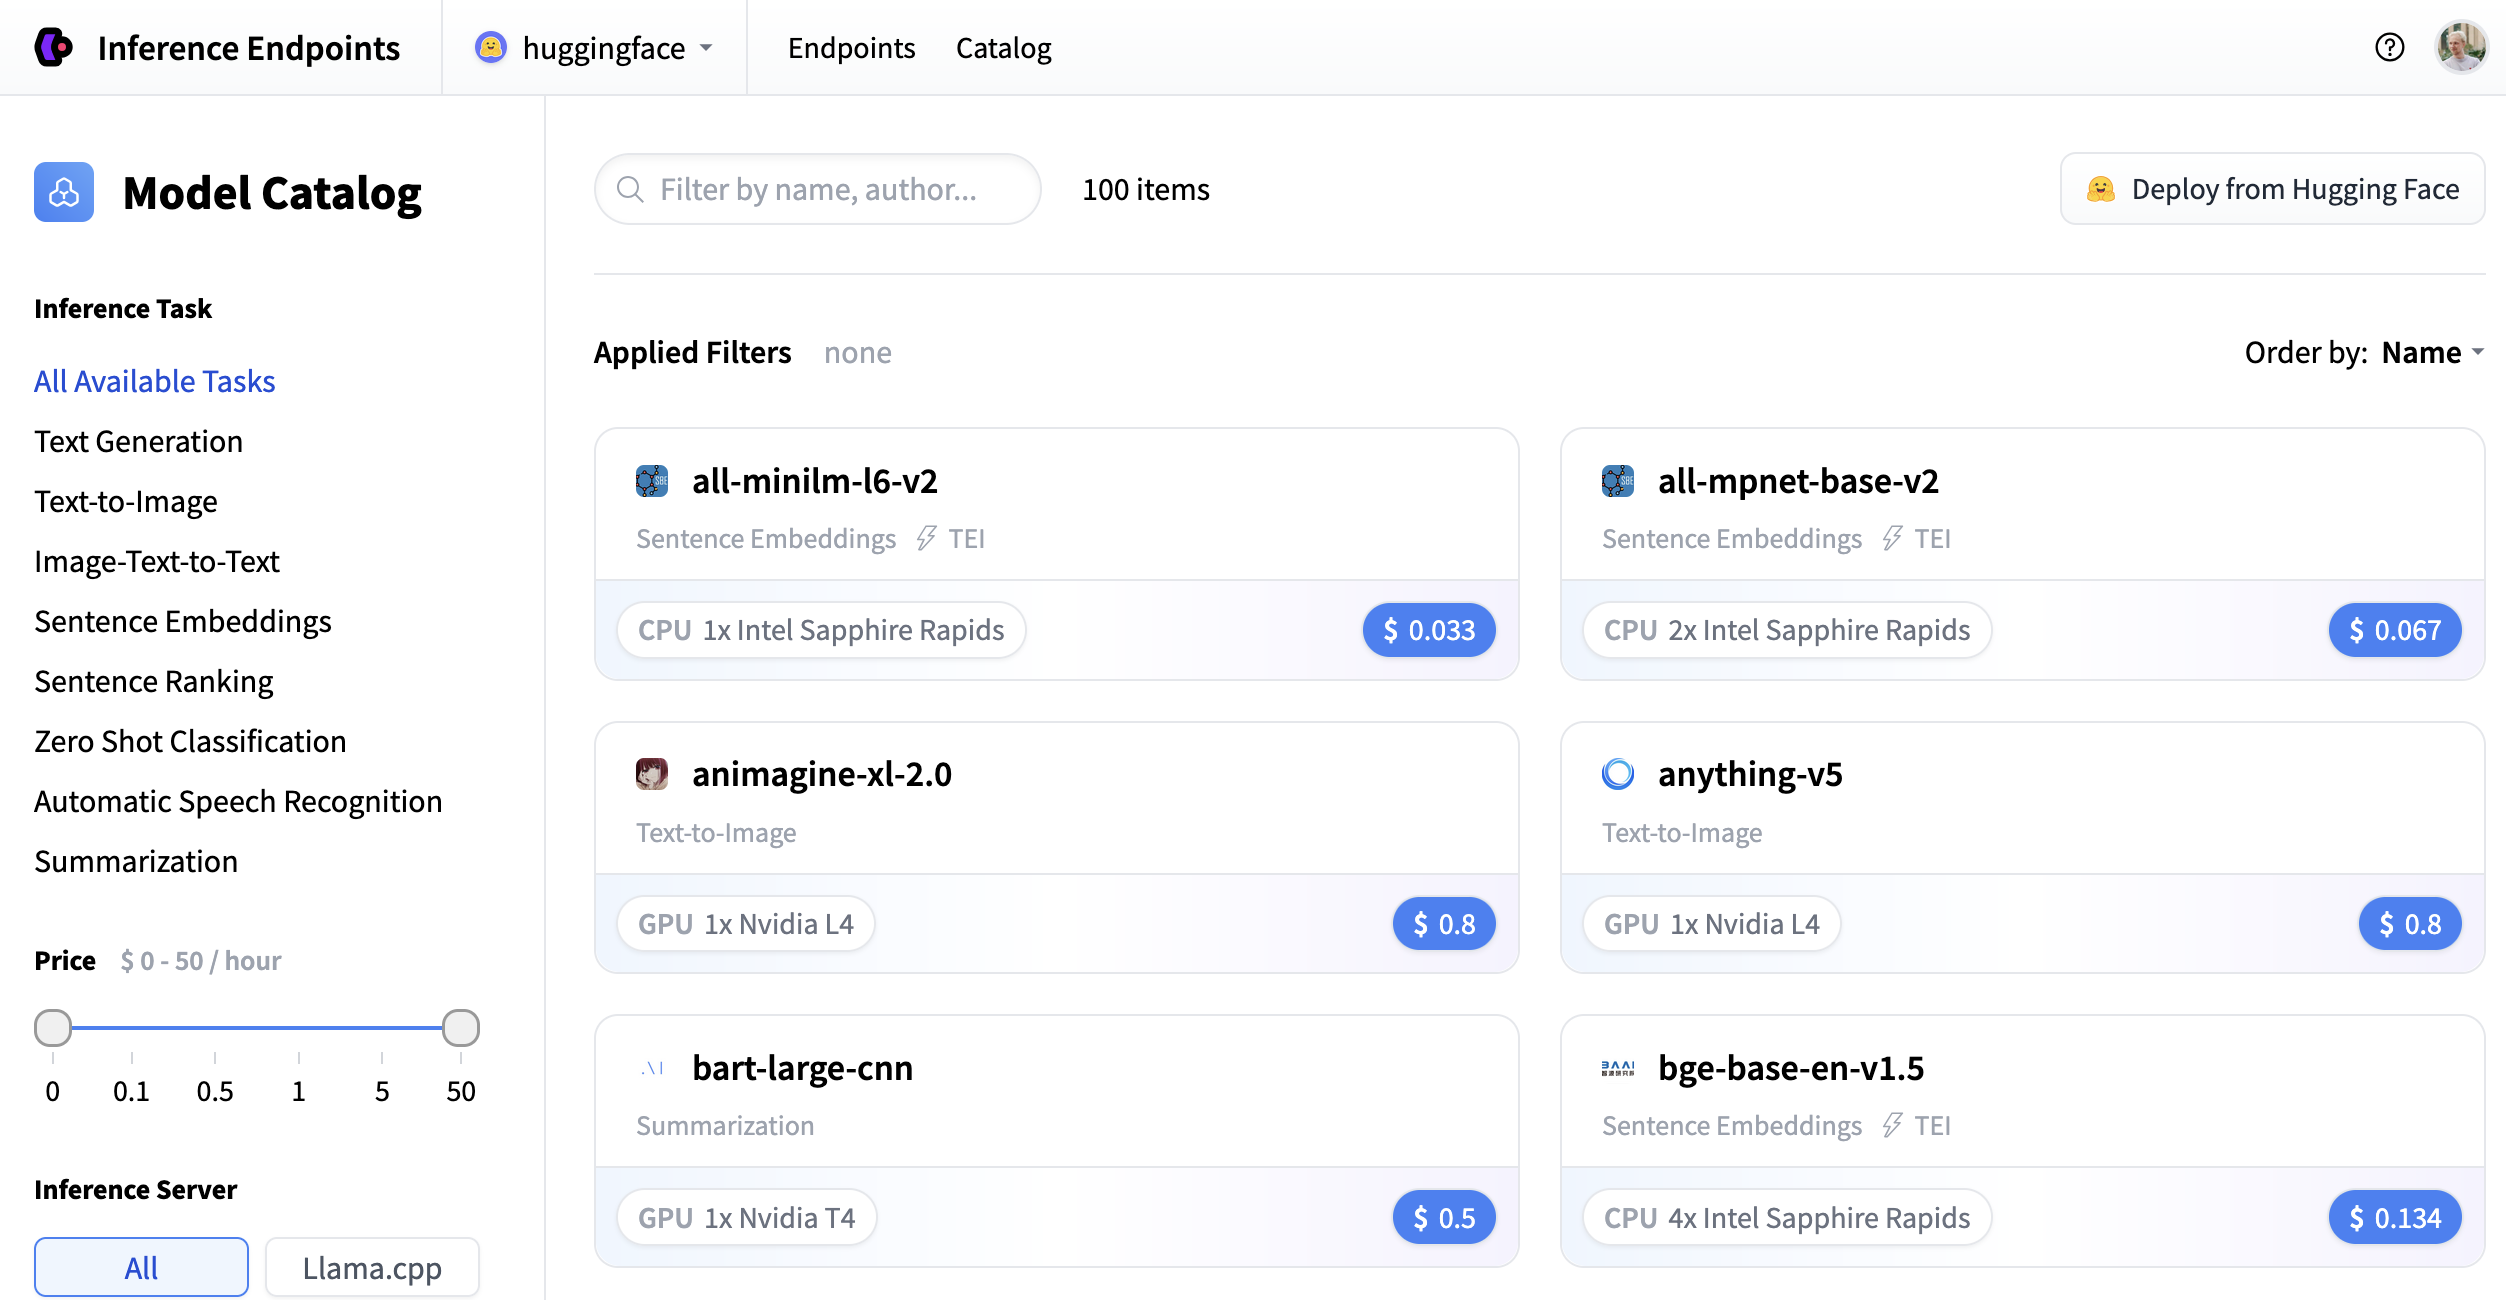
Click the Catalog button to access the Model Catalog. This will take you to the Model Catalog which provides access to 100+ pre-configured models available for deployment as inference endpoints. Use this to browse, filter, and deploy models directly.
If you cannot find a suitable model in the catalog you can click the Deploy from Hugging Face button (or press F). This opens a search overlay across the Model Catalog and the full Hugging Face Hub, allowing to deploy pre-configured models available as well as any Hub repository.
After this you will be directed to the configuration page. You can read here more in detail about all the configuration options.
Endpoint States
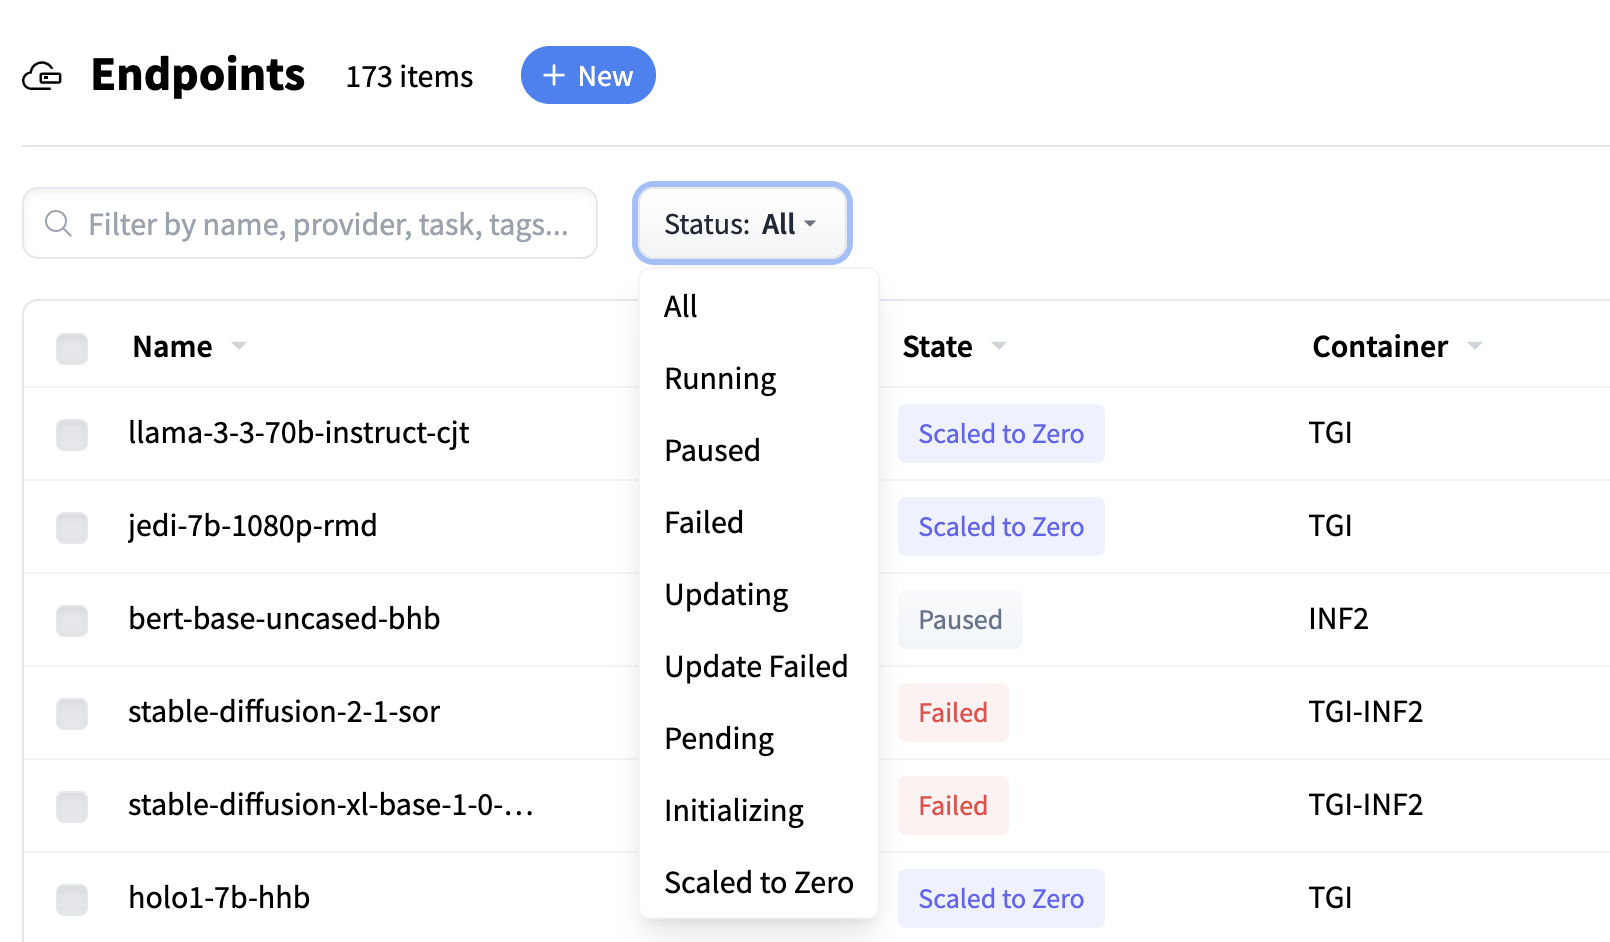
Endpoints can be in one of several states:
- Pending: Endpoint has been created but hasn’t started initializing yet
- Initializing: Endpoint is starting up
- Updating: Endpoint is applying a configuration change
- Running: Endpoint is ready to serve requests
- Paused: Endpoint has been stopped, which counts towards your quota
- Scaled to Zero: Endpoint is idle and consuming no compute resources
- Failed: Endpoint encountered an error and is not operational
- Update Failed: Endpoint’s last configuration update failed to apply
Managing existing endpoints
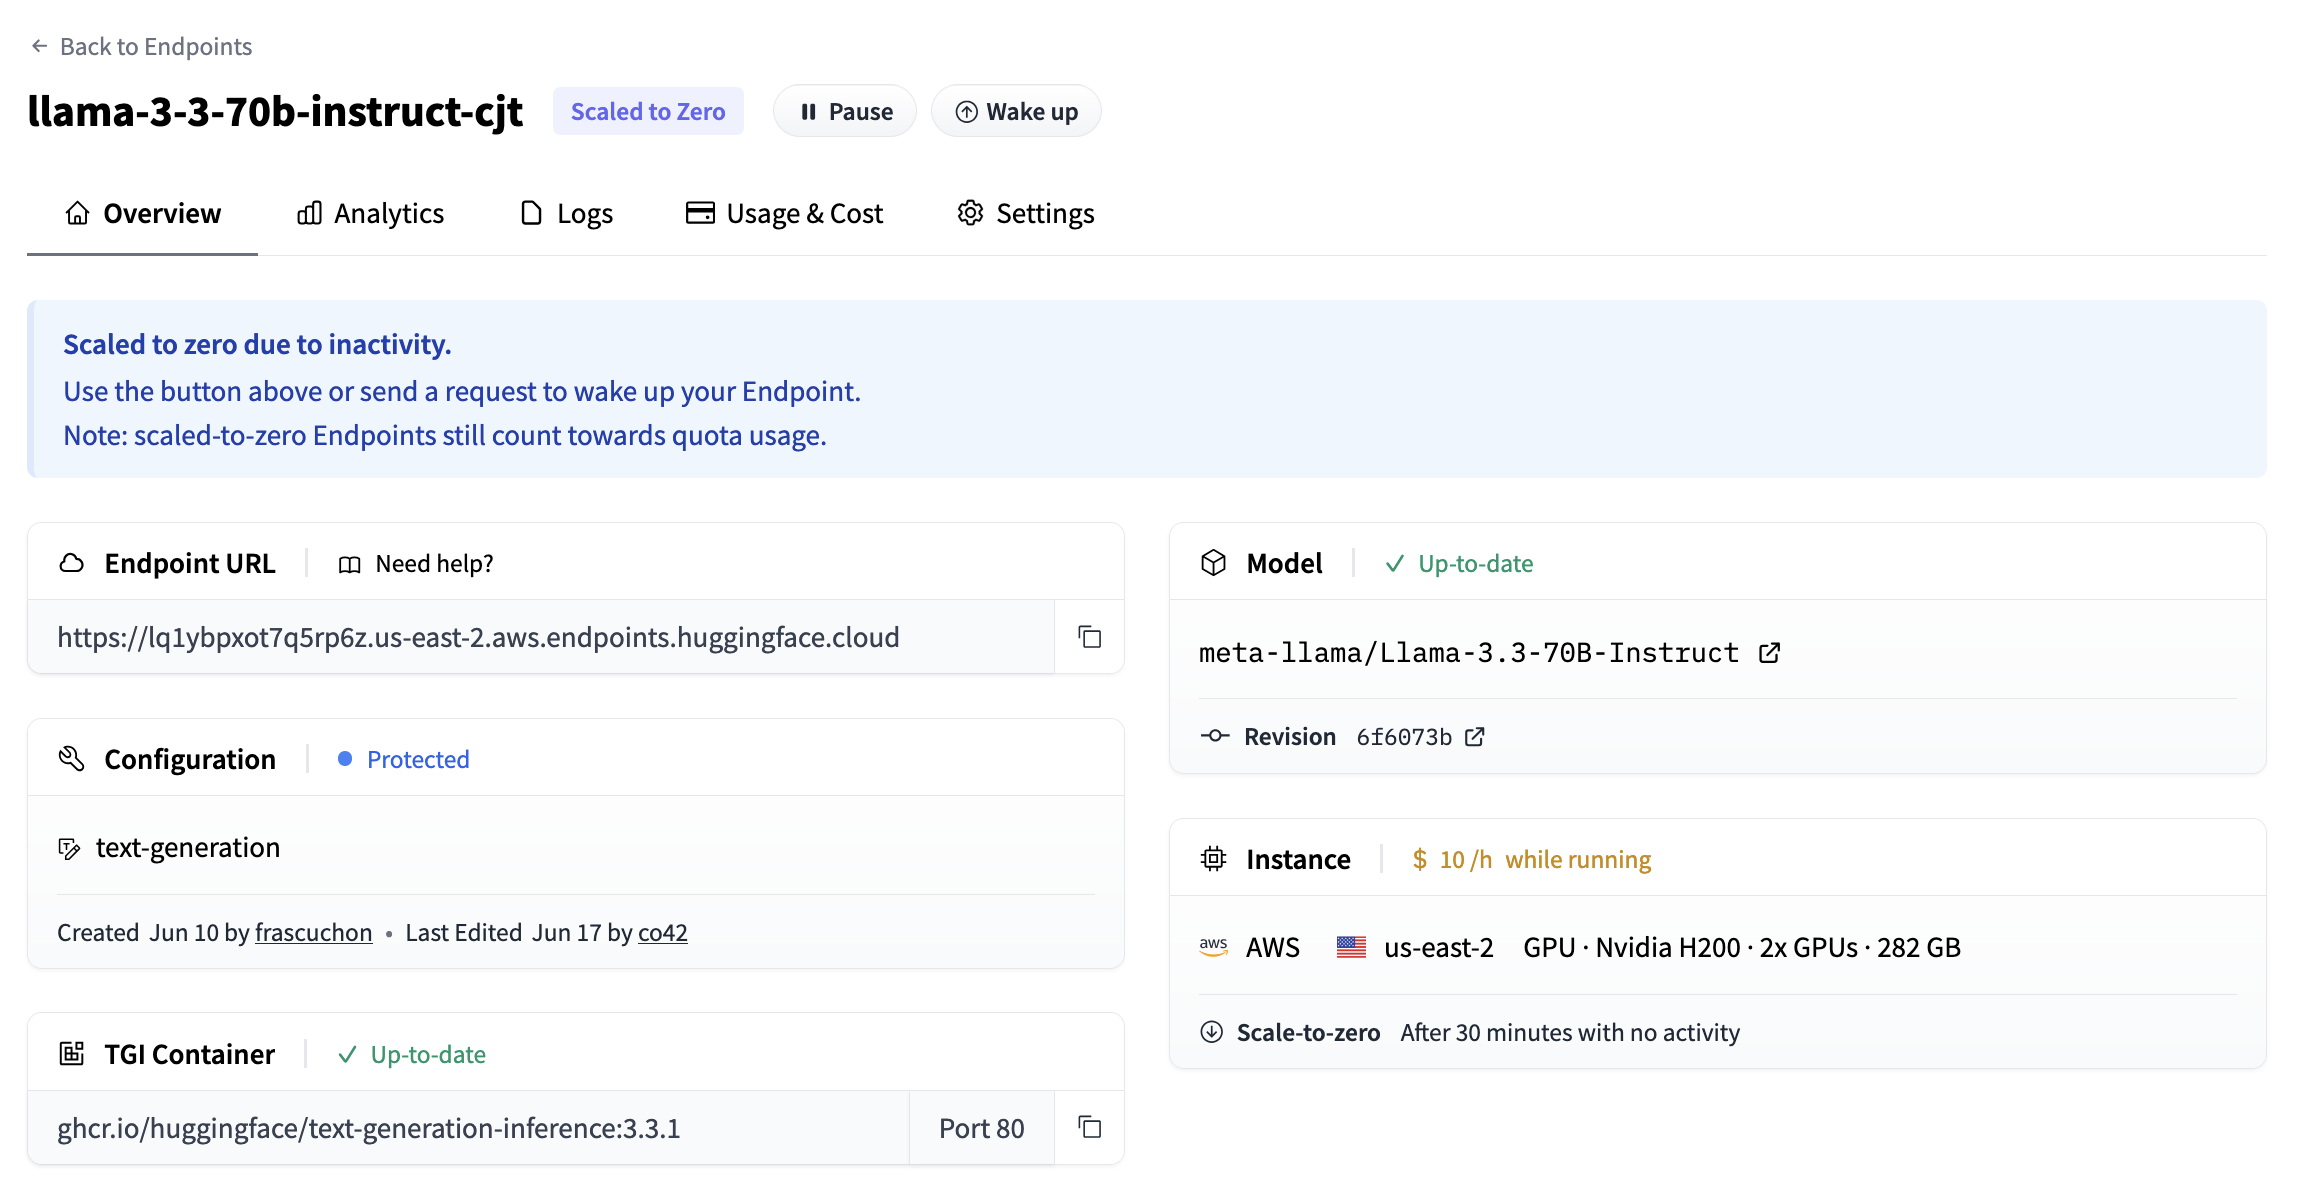
The endpoint details page provides information and lets you control the configuration of an individual endpoint. Access this view by clicking on any endpoint from the main endpoints list.
The endpoint name displays with its current state. You can pause a running endpoint or wake up an endpoint scaled to zero.
- Overview: Current status and configuration summary, including a usage and billing summary card
- Playground: Quickly test the model with a simple UI, without writing any code
- Analytics: Performance metrics and usage statistics, for more in-depth reading please visit here
- Logs: Runtime logs and debugging information, more in-depth docs can be found here
- Settings: Configuration and management options
The page displays the configuration options that are available for each endpoint. You’ll find a more in-depth walk-through of all options under the configuration section
Using the Dashboard
Viewing Endpoint Information
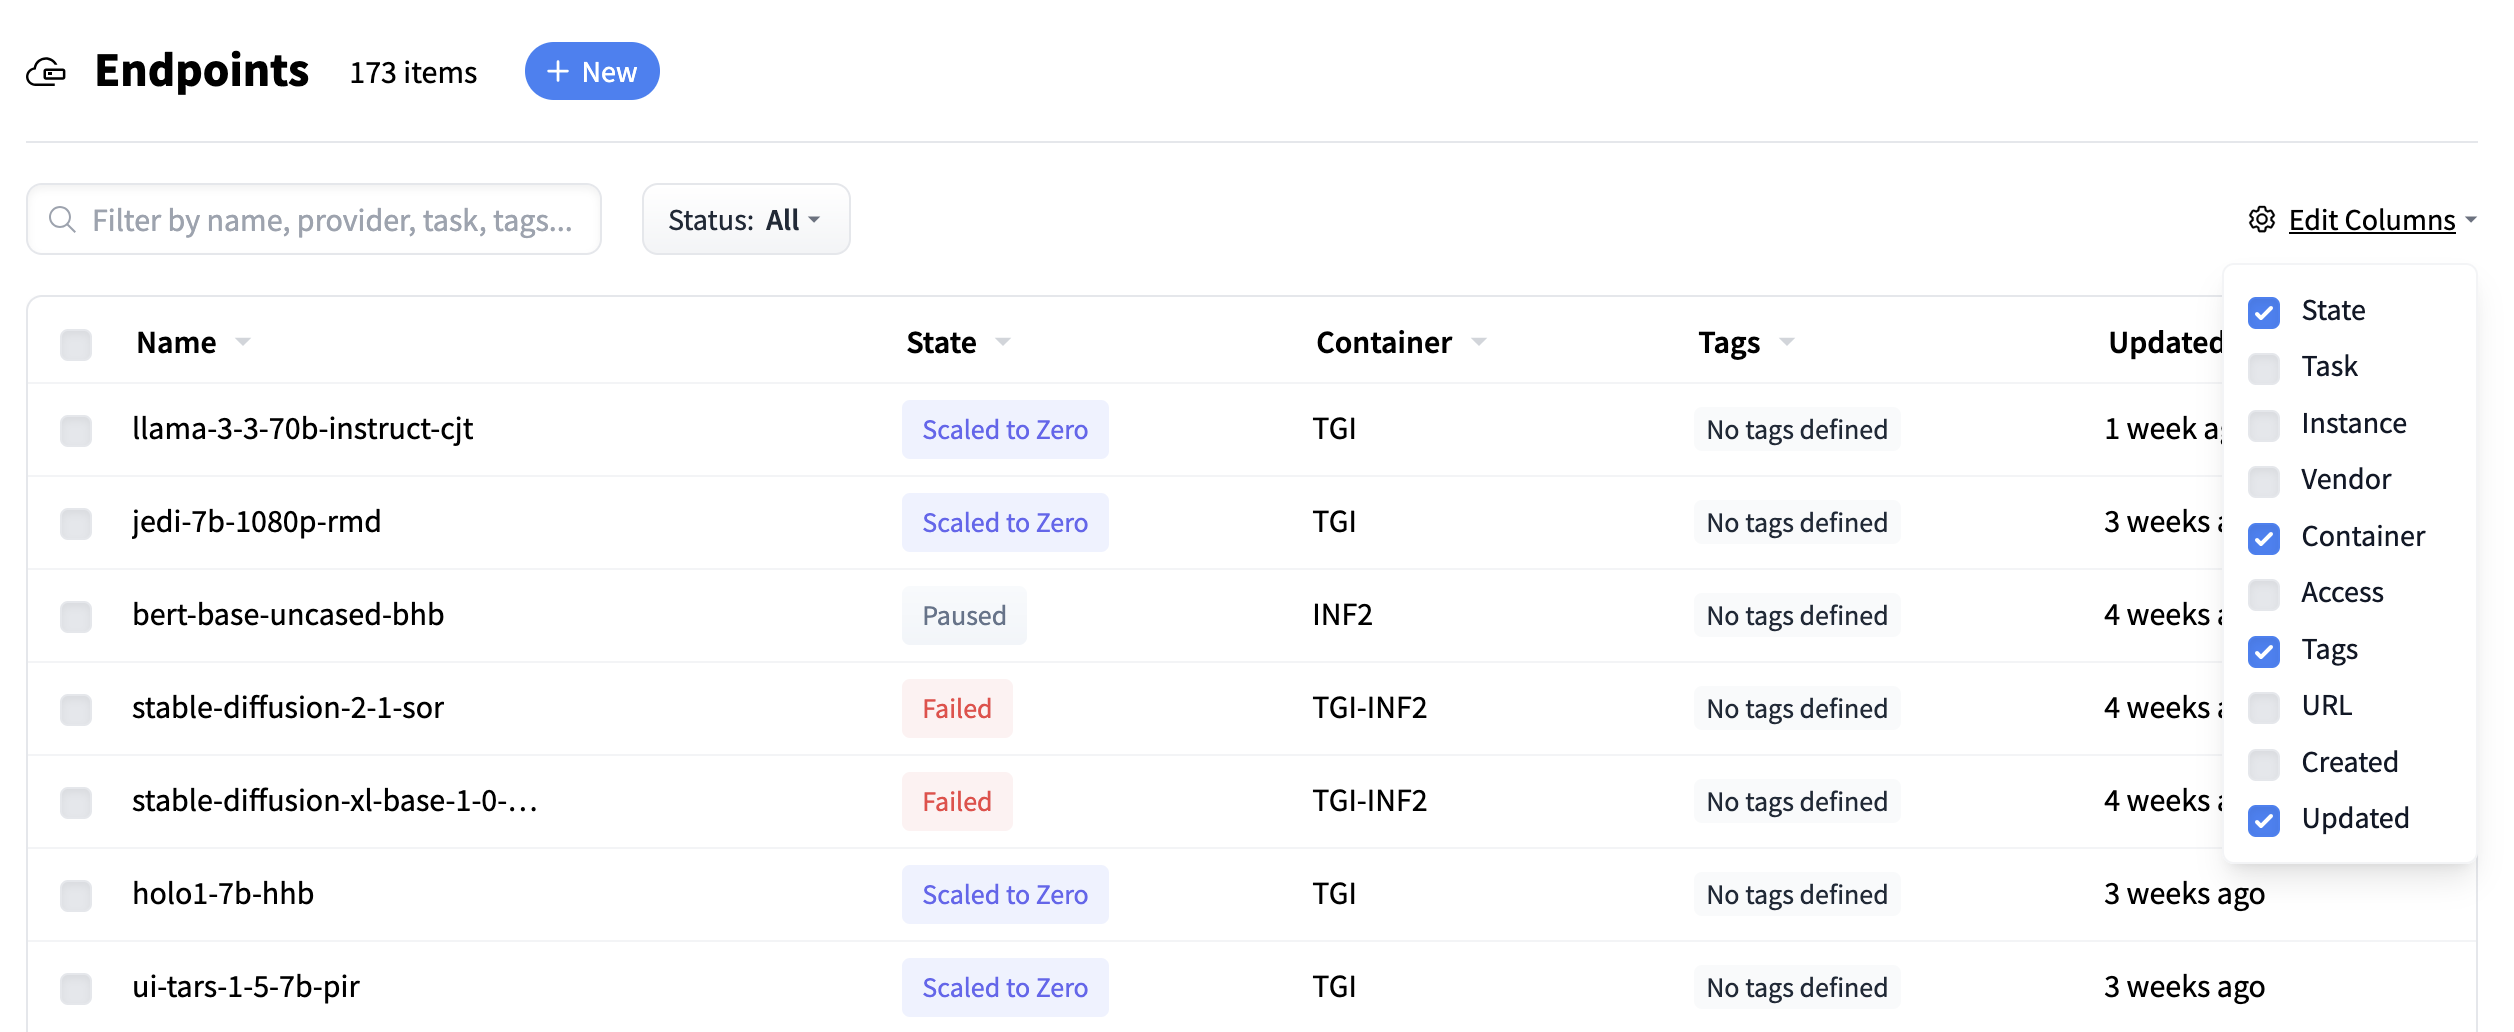
The endpoints table displays critical information for each deployment. Click the column-settings icon (⚙) to show or hide specific information columns. Available columns include Name, State, Task, Instance, Vendor, Inf. Engine, Auth., Tags, URL, Created, Created by, Last edited by, Updated, and Last Activity timestamps
Filtering and Search
Use the search bar to filter endpoints by name, provider, task, or tags. The Status dropdown allows filtering by specific endpoint states.
Account Management
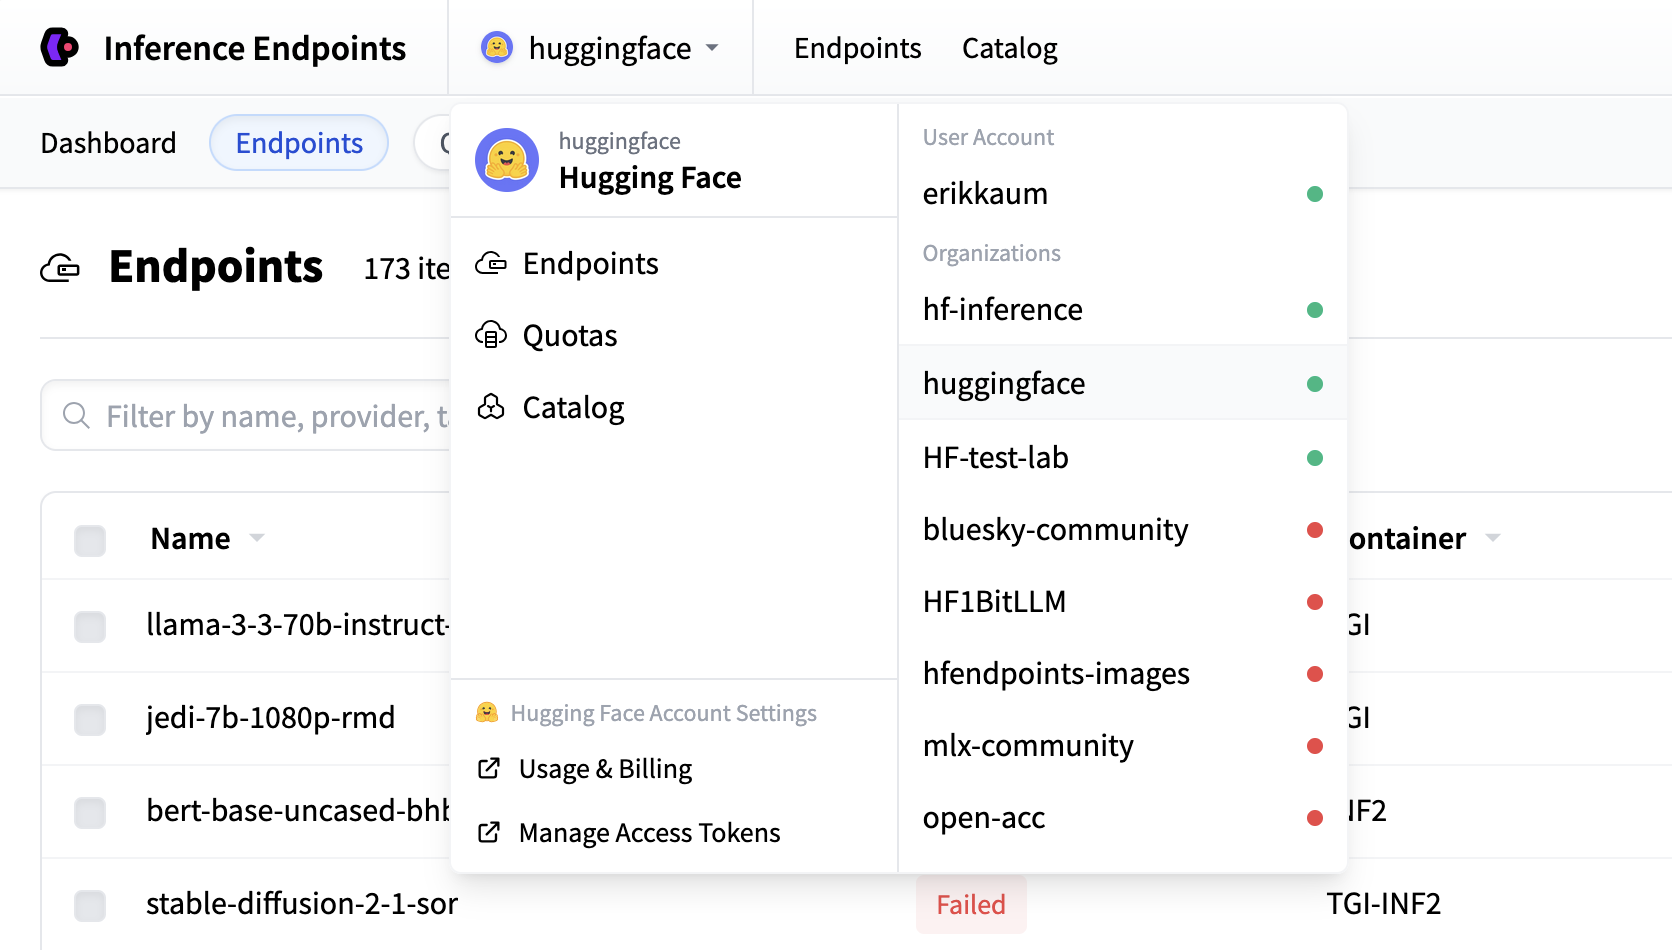
Access account and organization switching through the menu next to the logo in the top-left corner — this also provides access to API tokens, quotas, audit logs, and catalog links. The avatar menu in the top-right corner allows you to Change User and Log Out.
Quotas
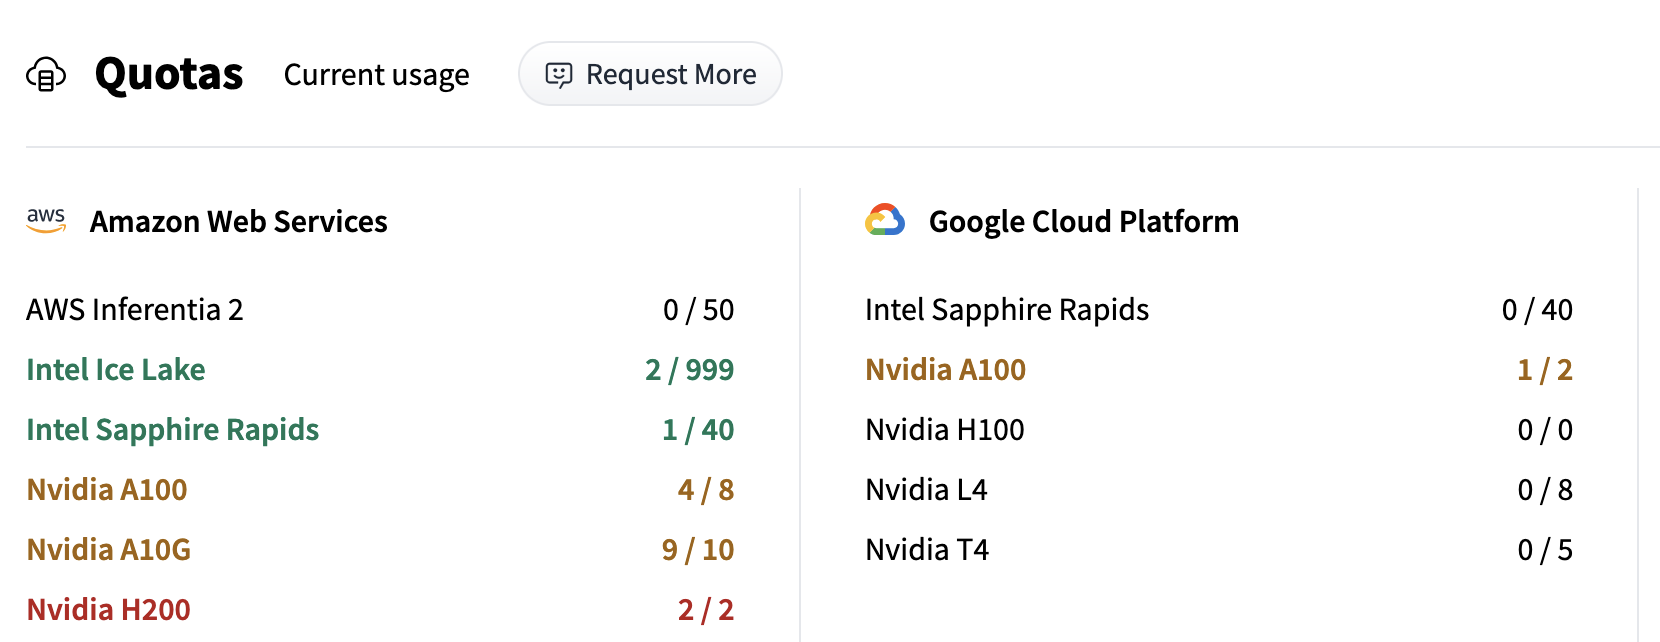
The Quotas section displays your current resource usage and limits across different cloud providers and hardware types. Access this view to monitor consumption and request additional capacity when needed.
Note that:
- Paused endpoints will not count against ‘used’ quota.
- Scaled to Zero endpoints will be counted as ‘used’ quota—simply pause the scaled-to-zero endpoint if you would like to unlock this quota.
Requesting Additional Quota
Use the Request More button to submit requests for increased limits when approaching quota thresholds. This allows you to scale your inference deployments beyond current allocations. Or click the button below:
Request MoreAudit Logs
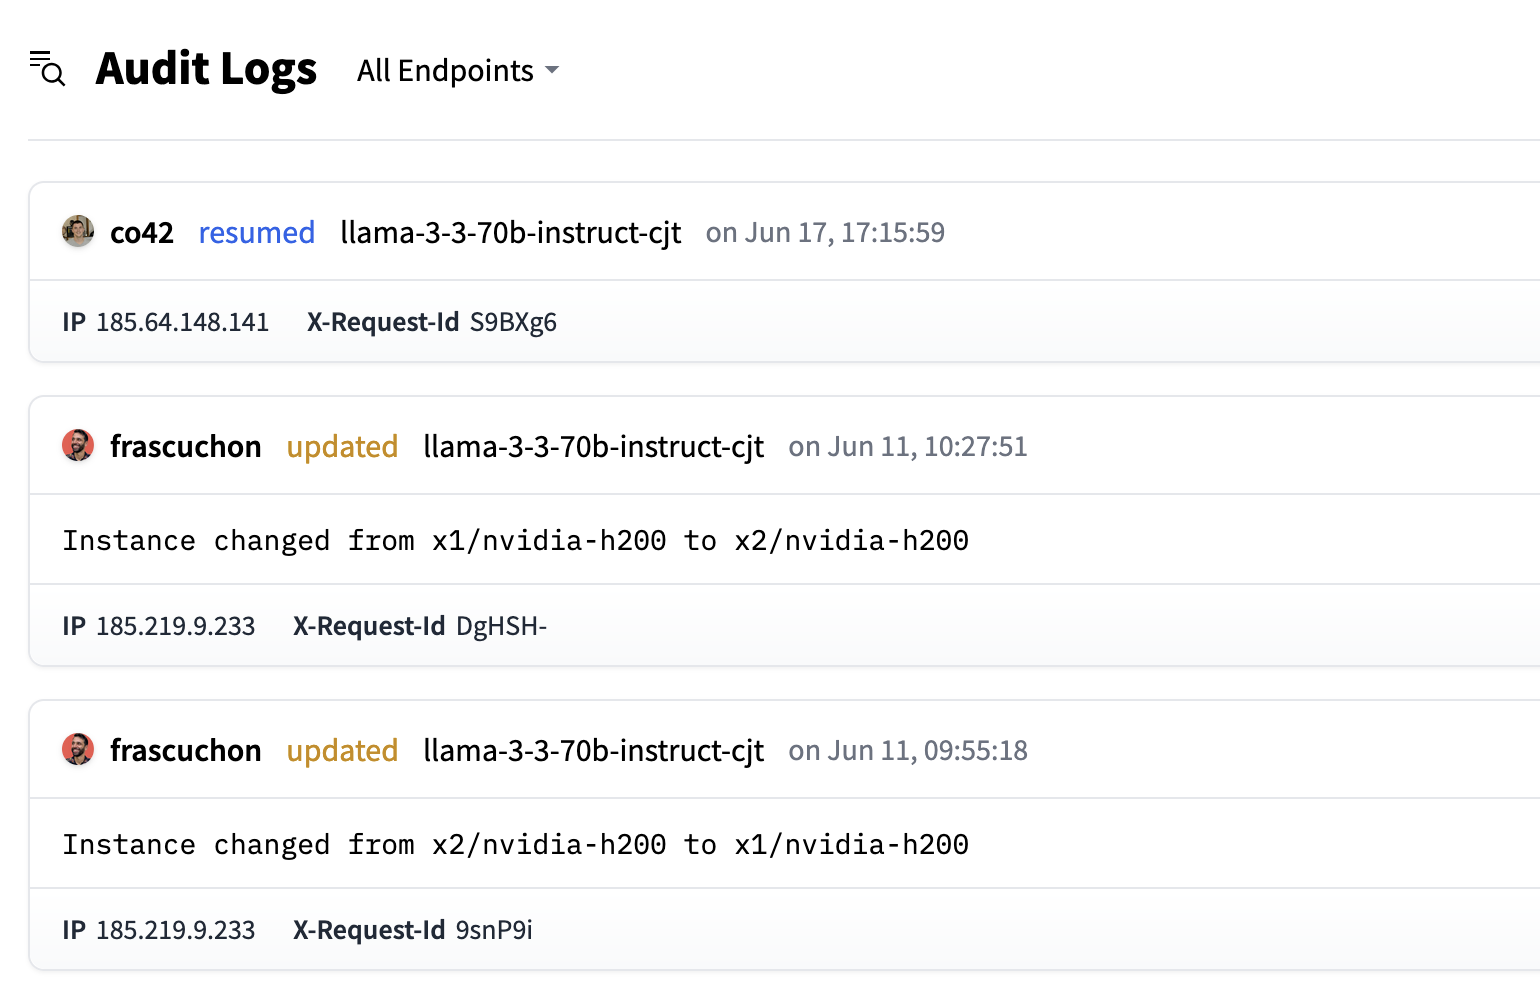
The Audit Logs section provides a chronological record of all actions performed on your inference endpoints. You can use this to track changes, troubleshoot issues, and maintain security oversight of your deployments.
Use the endpoint search field to filter logs down to a specific endpoint instance — leave it empty to see activity across all endpoints in the namespace.
Log Entry Structure
Each audit log entry is displayed as a card showing:
- The user’s avatar, name, and the timestamp of the action
- The action performed (created, paused, resumed, updated, deleted, etc.) and the affected endpoint
- For updates, a summary of what changed (e.g. instance/hardware scaling, configuration parameters, or state changes)
- Request metadata for troubleshooting, shown inline: the source IP address and the X-Request-Id used to trace the API call